
")
")
")
")
")
")
")
")
")
")
")
")
")
Enterprise Data Quadrants Template
Original price was: $85.00.$75.00Current price is: $75.00.
Need to explain complex relationships and compare the differences? This template can help. It is designed to create quadrants that compare multiple relationships similar to a Gartner-Styled Magic Quadrant. The template is focused on Enterprise Data Exchange; however it can be easily tweaked for a wide range of use cases.
Description
This package contains a comprehensive Visio template which illustrates key aspects of information exchange and transformation. The diagram covers a wide range of data-related categories, each tab fully customizable based on your unique requirements. The content can be “tweaked” for a wide range of use cases, everything from creating a “Gartner-like” magic quadrant / grid, to simple grids to compare various dimensions of concepts and ideas. The template allows for the placement of information which can be compared to one another across quadrants by simply changing the x/y axis data.
In may cases, these diagrams can be used to explain relationships for complex relationships which are visually hard to explain. For example, the template can be tweaked to show the alignment of trends, scope, patterns and placement across four dimensions – which is completely customizable. Out of the box, the tabs contain the following elements:
- Market Grid
- Simple Grid
- Interleave Grid
- Data Federation
- Enterprise Information Integration (EII) Grid
- EII to Daya Federation Grid
- Service Oriented Architecture (SOA) Grid
- Enterprise Application Integration (EAI) Grid
- Operational Data Storage (ODS) Grid
- Virtual Operational Stores (Cloud) Grid
- Business Activity Monitoring (BAM) Grid
- Enterprise Transform and Load (ETL) Grid
- Interweave Detail Cross-Map Grid (All Models)
The content behind this diagram is intended to explain the relationships between different methods of information management and usage. Without modification, these grids can be used to illustrate the various relationships between the terms identified above. This can be very useful when preparing material to explain when, where and how to use each of these information management methods.
In addition to the base template as outlined above, by changing the content of the grids new and unique material can be easily created with minimal knowledge of Visio, for example, creating a grid to explain Application Release Automation (ARA) using two different strategies:
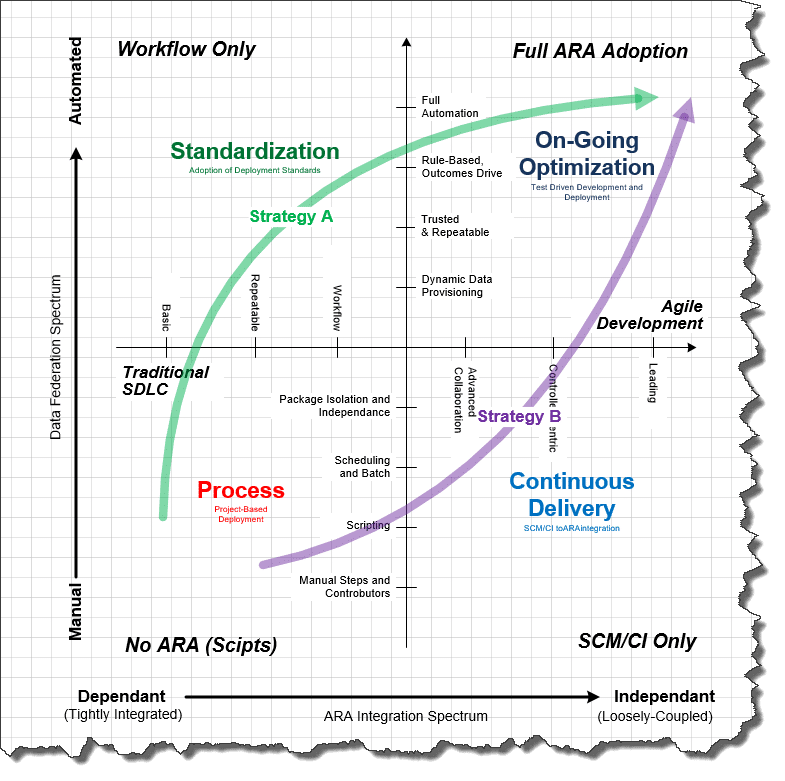
Content can be easily manipulated using this approach to illustrate complex relationships merely by changing the basic information in the template. The potential use cases for this template are truly endless.
The package comes complete with a PDF of the base grids, and the source for all the grids in both Visio 2016 and a backward compatible format supporting Visio 2003-2010.
Reviews
There are no reviews yet.