Operational eXcelence (OpXcel), is a concept which has been around in one form or another for many years. The roots for this term could be viewed from a Six Sigma context – namely DMAIC (Define, Measure, Analyze, Improve and Control). The key word here is to “improve”, but how?
Most organizations struggle with attempting to roadmap OpXcel. There is a tremendous degree of misinformation surrounding the term. For example, the terms DevOPS and OpXcel are used synonymously – this couldn’t be farther from the truth. While both imply a means to end to drive improvements and efficiencies, they are in fact very different. DevOPS is focused on “Continuous Improvement” from a development / delivery perspective; rather than business-driven improvements measured by well understood Known Performance Indicators (KPIs) which define measures for success or failure – this business context is really what makes OpXcel unique.
When developing a roadmap OpXcel it is important to ensure an alignment to a customer’s experience. The biggest challenge is “Stewardship” – the ability to have people take ownership of their role in the OpXcel journey. To help solve this problem it is helpful to create a ‘Vision” for the end-state for OpXcel. This means a clear approach with a well understood action plan (the steps) for implementation without impacting current operations.
Creating the Vision
So how do you go about creating a vision? Perhaps the easiest way is to develop a set of achievable benefits that people can rally around. This implies “simplicity“, with a focus on goals that create immediate benefits.
A framework that promotes that vision using known measures that have a real impact, for example – “Downtime“? While we all know that downtime is bad, to create a vision you have to quantify what “bad” really is and what it means to the customer’s experience.
Some of these questions may have been asked in the past; however in most cases the answers were “fluffy” at best. To really get traction, it helps to be exact and understand the impact in terms of the business, which means money, reputation, brand-awareness, etc.
OpXcel Framework
This is where a “Framework” comes in. It ties these questions (and many others), to areas of improvement which can be associated with targets. Each target can have a set of action items which can be envisioned within a timeline – immediate, short-term or long-term in order of relevance and benefit.
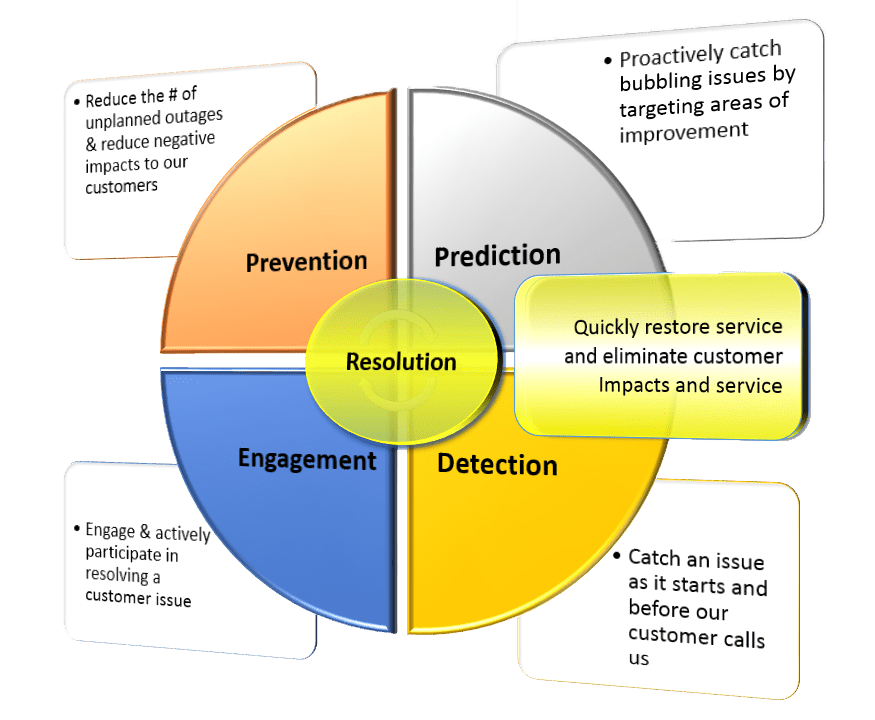
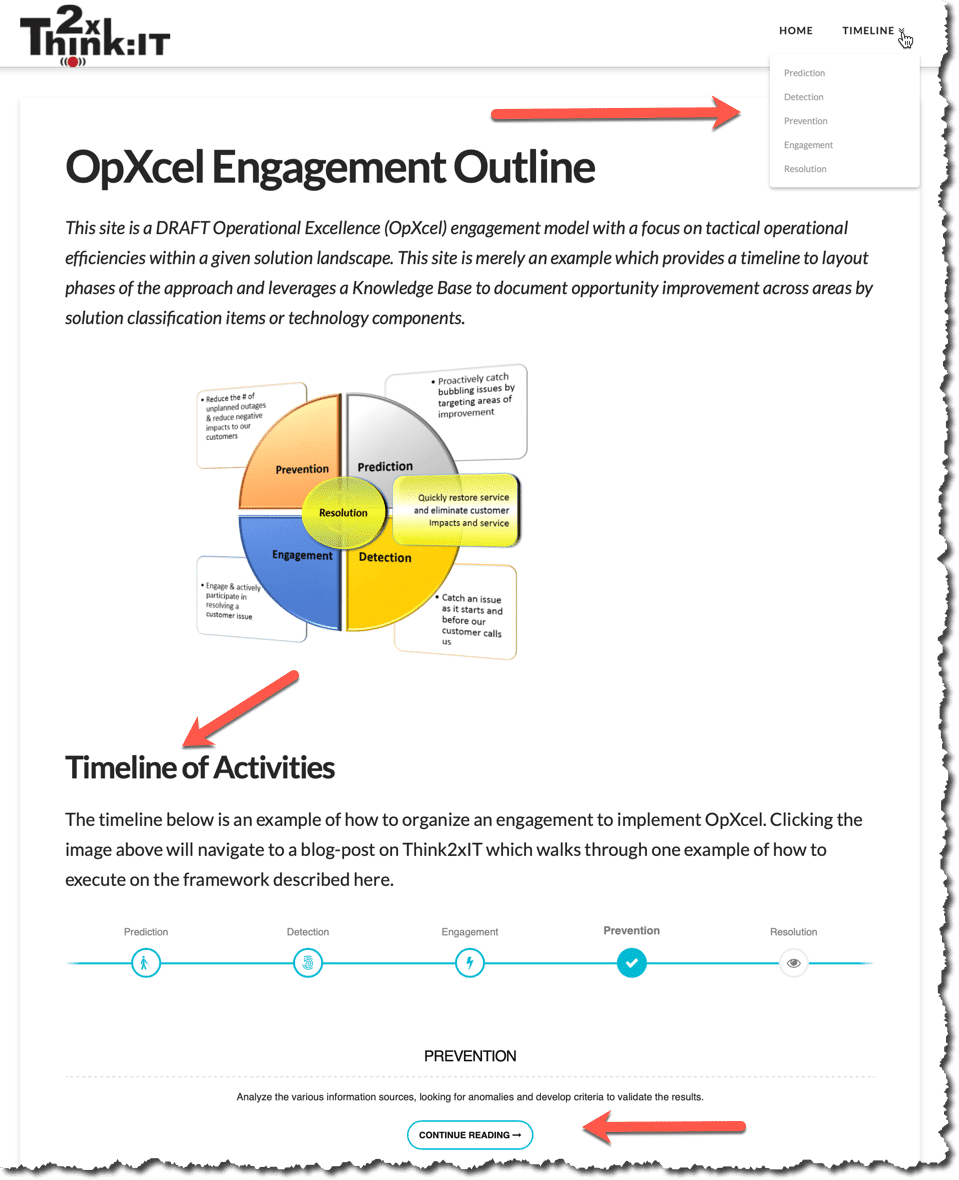
Creating a visual to express the concepts can be very helpful, the one shown here attempts to embody four key focus areas – Prevention, Prediction, Detection and Engagement.
Each focus area has a set of actionable steps which help drive improvements towards a “Resolution” of known issues via the framework’s actionable steps.
This visual provides a clear perspective and demonstrates that focus areas can be defined that are not lofty or complicated.
The process of taking inventory and collecting data based on current issues also needs to be performed with a strong focus on metrics to give a level of importance and urgency to the OpXcel actionable steps. By drawing on past measures, this helps to create a “common understanding” of these focus areas and helps improve the chances for executive buy-in, funding and support.
Framework Outcomes
With a vision and a structure for the framework, the next step involves making it “real” in terms of outcomes. These outcomes need to align to the impact that an event may have on the business. The outcomes have to demonstrate actionable steps for resolution to prevent the event (such as an outage). These benefits come from mapping “working objectives” to each team so that the resources on each team are accountable for each outcome and thereby the resolution and/or action items associated with the event. This is key, without people understanding their role in the OpXcel journey it makes it virtually impossible to deliver improvements. A good framework should provide that clarity.
| Goal | Working Objective | Metrics | Owner / OPI | Target Date |
|---|---|---|---|---|
Reduce the number of unplanned outages | - Improve quality of product | - 25% reduction in QA defects - 25% reduction in production defects | Development | Q4 |
| - Automate packaging and deployment | - Reduce deployment time via automated packaging and scripting - Reduce lead-time to promote using automation | Development Application Support | Q2 | |
| - Build consistent environments using automation and templates | - Max of 5 environmental issues per Quarter across all top-tier, level-1 applications | Infrastructure Application Support | Q3 |
| Goal | Working Objective | Metrics | Owner / OPI | Target Date |
|---|---|---|---|---|
Proactively catch issues through trending and monitoring | - Publish bi-weekly top 3 opportunities list | - Implement a Bi-Weekly opportunity list by LOB and Application portfolio - Produce daily operational performance reports by LOB portfolio - 30 days to remedy items from the top 3 on the opportunities list | Development Application Support Operations | Q2 |
| - Establish SLAs for top 25 applications | - Develop APM thresholds to pinpoint SLAs breaches | Development Application Support | Q2 | |
| - Resolve repeating issues - Better RCAs | - Develop reports to track progress and trends - Identify the top 5 repeating issues | Development Infrastructure Application Support | Q4 |
| Goal | Working Objective | Metrics | Owner / OPI | Target Date |
|---|---|---|---|---|
Catch an issue as it starts and before our customer calls us | - Develop performance dashboard for top 25 applications | - Implement a Bi-Weekly opportunity list by LOB and Application portfolio - Produce daily operational performance reports by LOB portfolio - Dashboard for top 25 applications with real time health checks - 50% of system issues/incidents self detected through APM monitoring in 1st year | Development Application Support Operations | Q2 |
| - Real-time alert and notification of issues from APM | - Dashboard for top 25 applications with real time health checks - 50% of system issues/incidents self detected through APM monitoring in 1st year | Development Application Support Operations | Q3 |
| Goal | Working Objective | Metrics | Owner / OPI | Target Date |
|---|---|---|---|---|
Engage & actively participate in resolving a customer issue | - Service Health check | - OLAs for top 25 applications and related stack of LOB published portfolio | Development Application Support | Q2 |
| - Monitor and publish OLA breaches with 5 exceptions per portfolio | Application Support Operations | Q2 |
| Goal | Working Objective | Metrics | Owner / OPI | Target Date |
|---|---|---|---|---|
Quickly restore service and eliminate customer impact | - Run book automation for top 25 applications | - 25% reduction in Mean Time to Recovery | ALL | Q24 |
Validation of the Framework
Armed with a framework and a set of actionable items is great – but now comes the hard part, “How do we validate the framework and outcomes”? One approach is to Proof-of-Concept (PoC) the framework using whatever tools are available and then augmenting those tools with new technologies to fill any gaps.
An organization needs to examine their deployed solutions, looking for more than just infrastructure monitoring, the focus should be on the solutions which not only drive revenue, but that also impact the customer, brand or marketshare. This implies taking more of a transactional view in terms of metrics and also an ability to group solutions into common buckets like retail, commercial, enterprise, etc. In addition, find a way to collect metrics which could be categorized against application services to develop SLAs and OLAs with the business vision around them – all this without impacting current standards, or impacting performance on mission-critical applications.
These rather “fluid” requirements presented a significant challenge to the infrastructure team. We knew, very quickly, that the lead-time to deliver a testbed would stall any momentum achieved for OpXcel up to this point – how do we “validate” our framework, ratify our “working objectives” and prove to the various IT teams that they could deliver against OpXcel?
The best approach was to implement a sandbox environment which was capable of segmenting applications at the domain level using a series of sudo-environments provisioned using a concept called “Application Virtualization“. It enables a flexible, extensible, hybrid throw-away landscape without impacting current operations by segmenting applications via a proxy-like pass-through architecture. In this way we could play with various ways to view and categorize metrics in this sandbox without impacting anything or anyone. We would not need to reqest multiple servers, specialized network connections, or deal with complex deployment requirements.
By using open-source, turn-key solutions we could mimic the functionality of web-based customer experiences to determine our monitoring instrumentation options and the various metrics we needed to focus on. The type of application does not matter as much as the metrics they produce. Open-source web-based solutions such as CRMs, are excellent choices due to the nature of their architectural components. Using generic solutions also removes any concerns around data sensitivity.
A monitoring stack must be chosen and a target technology selected to implement OpXcel effectively, in many cases an Application Performance Monitoring (APM) tool is best suited for OpXcel. We selected a rock-solid set of tools, namely Dynatrace, which includes a collection of products that are deployed in a comprehensive manner to monitor a solution from multiple perspectives.
Our Compuware suite included Dynatrace, Gomez and DC-RUM. For this exercise we focused primarily on Dynatrace; the other tools could be integrated later, remember this PoC was to help us understand key measures, integration complexity, instrumentation options and notification methods.
Now that we had a working application farm, we installed Dynatrace on the same VirtualMin VM. This provided an ability to “instrument” applications in a similar manner to those running at the office. We could use this demo instance of the APM tool to start the process of validation of the key metrics required to demonstrate to the teams what they could monitor, how to monitor it and more importantly – how to answer some of those questions we posed to them earlier.
The vendor also provides a turn-key testbed solution called “Easy Travel” which emulates multiple conditions such Black Friday, Bad Deployments (simulated bugs), Development, Testing and more. This solves many issues and provides a parallel testbed to our previously discussed open-source CRM stack.
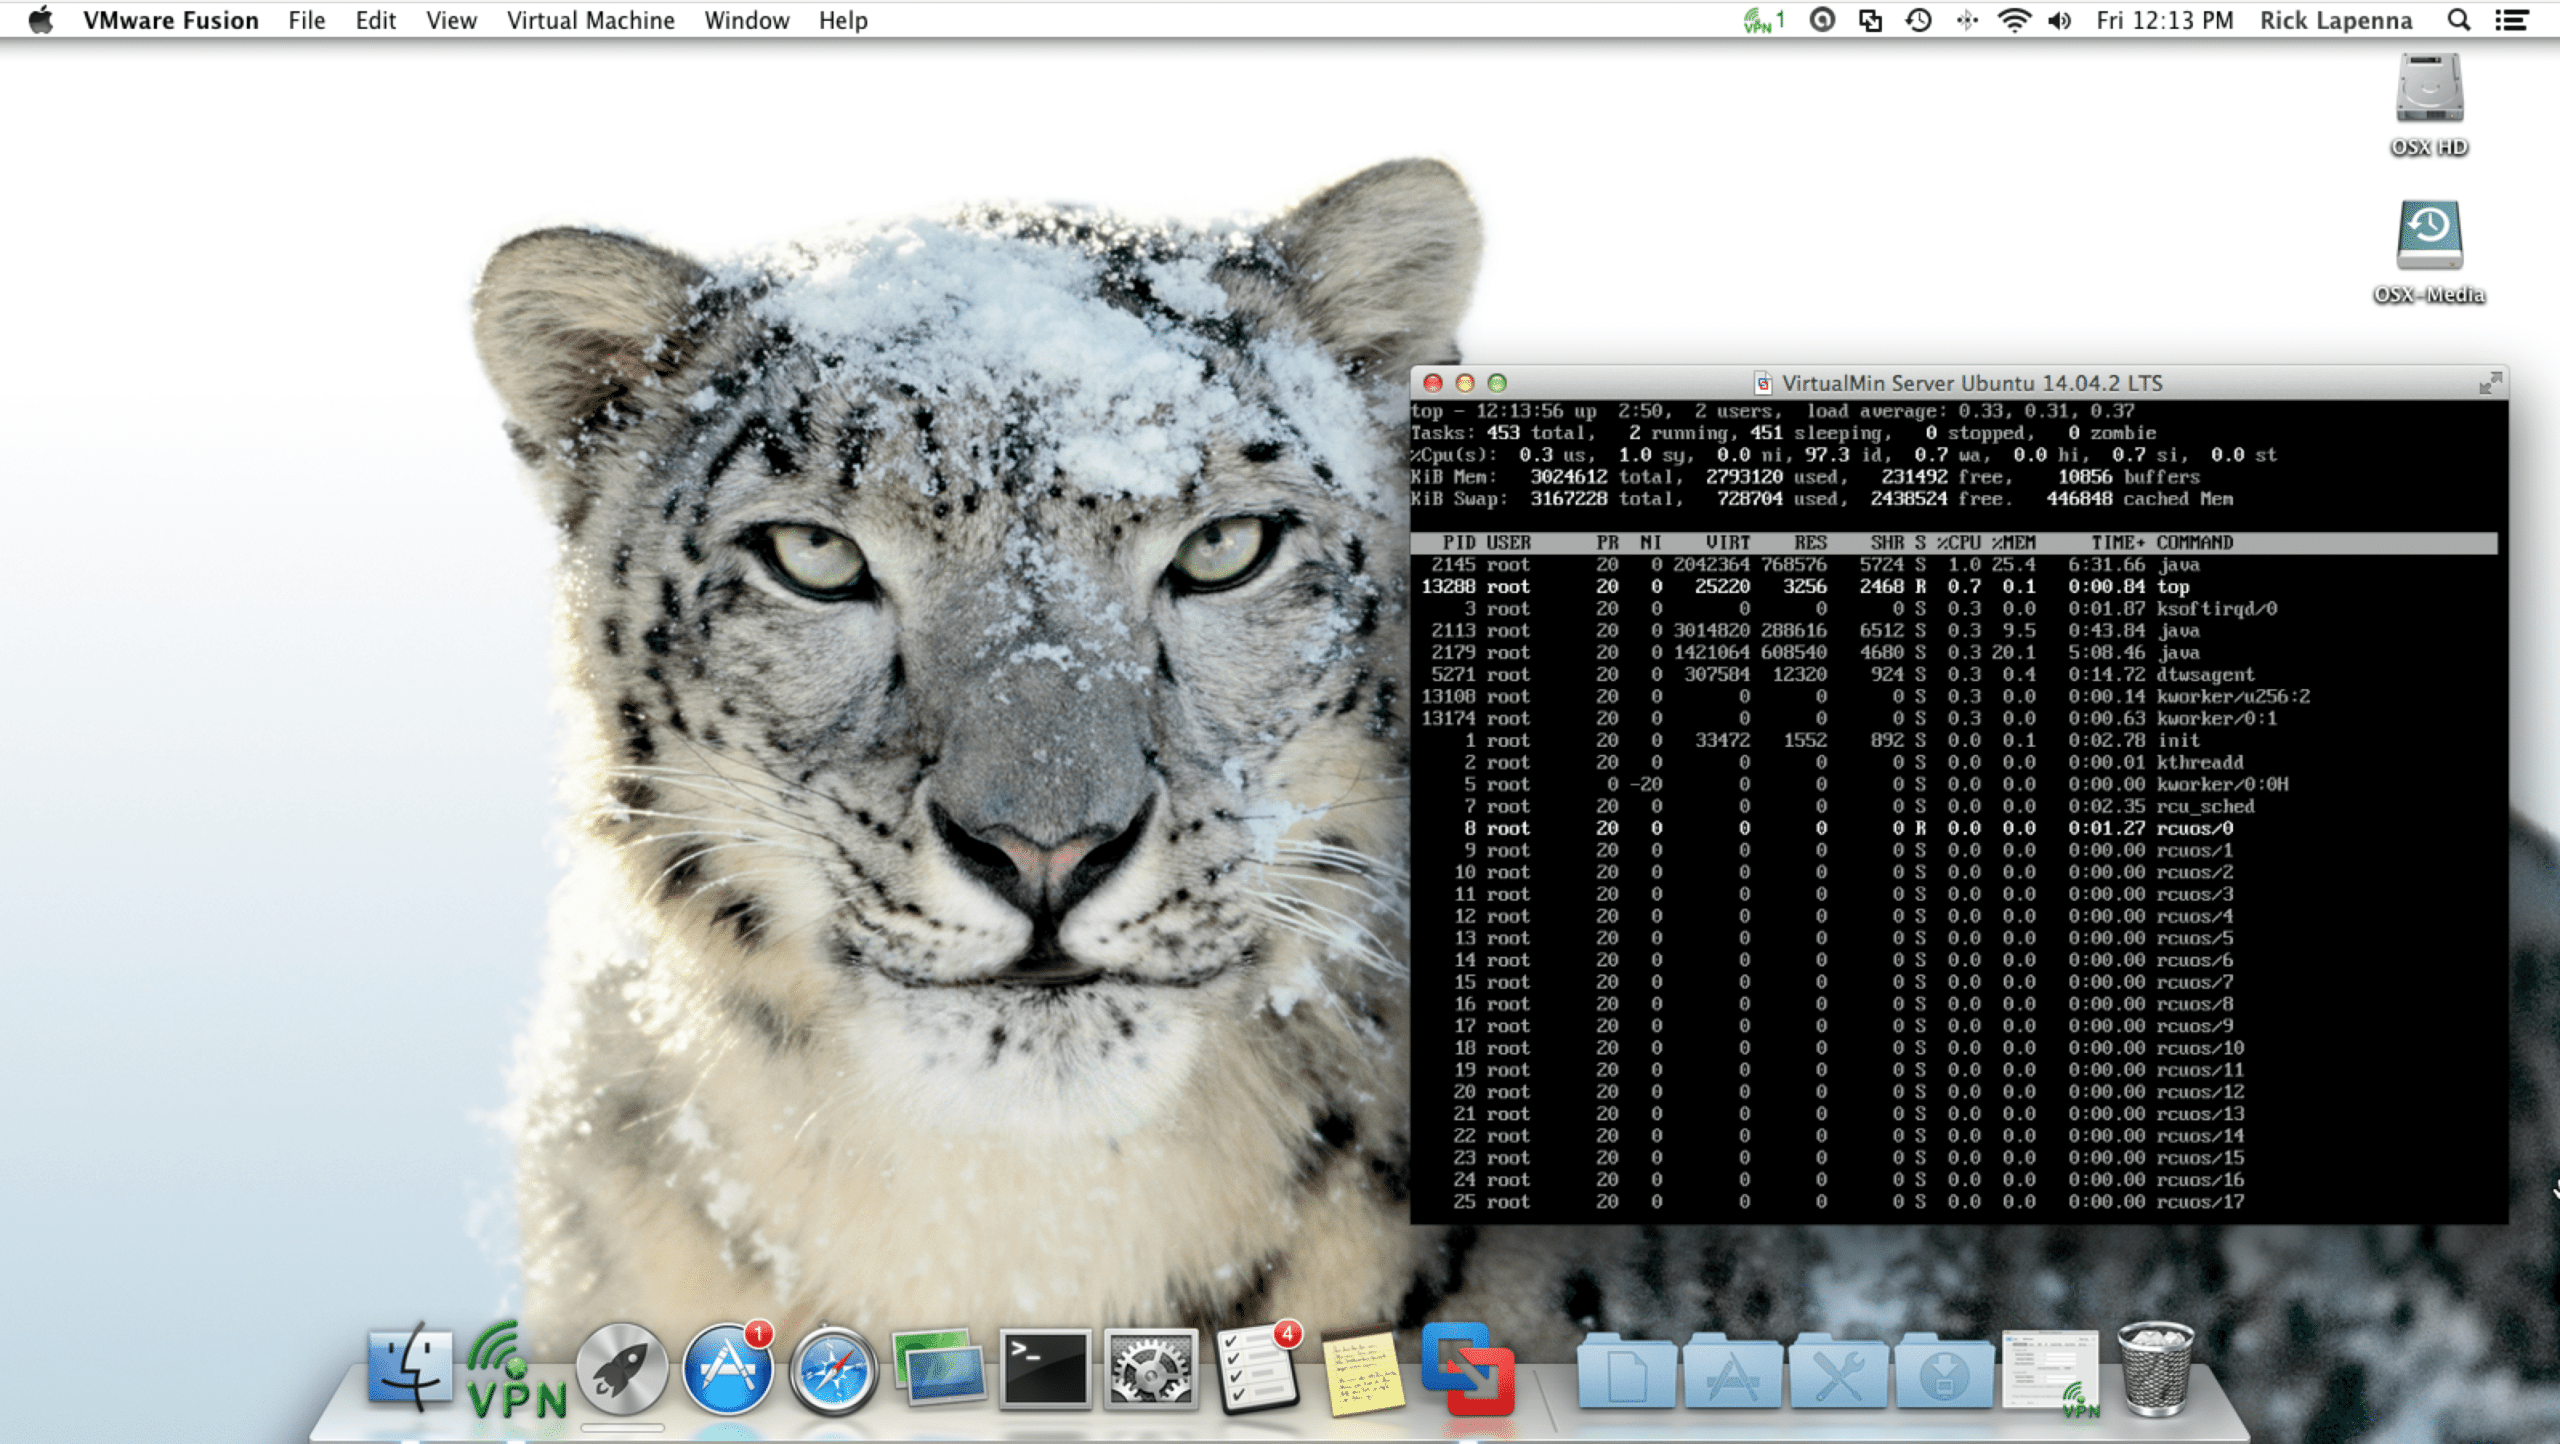
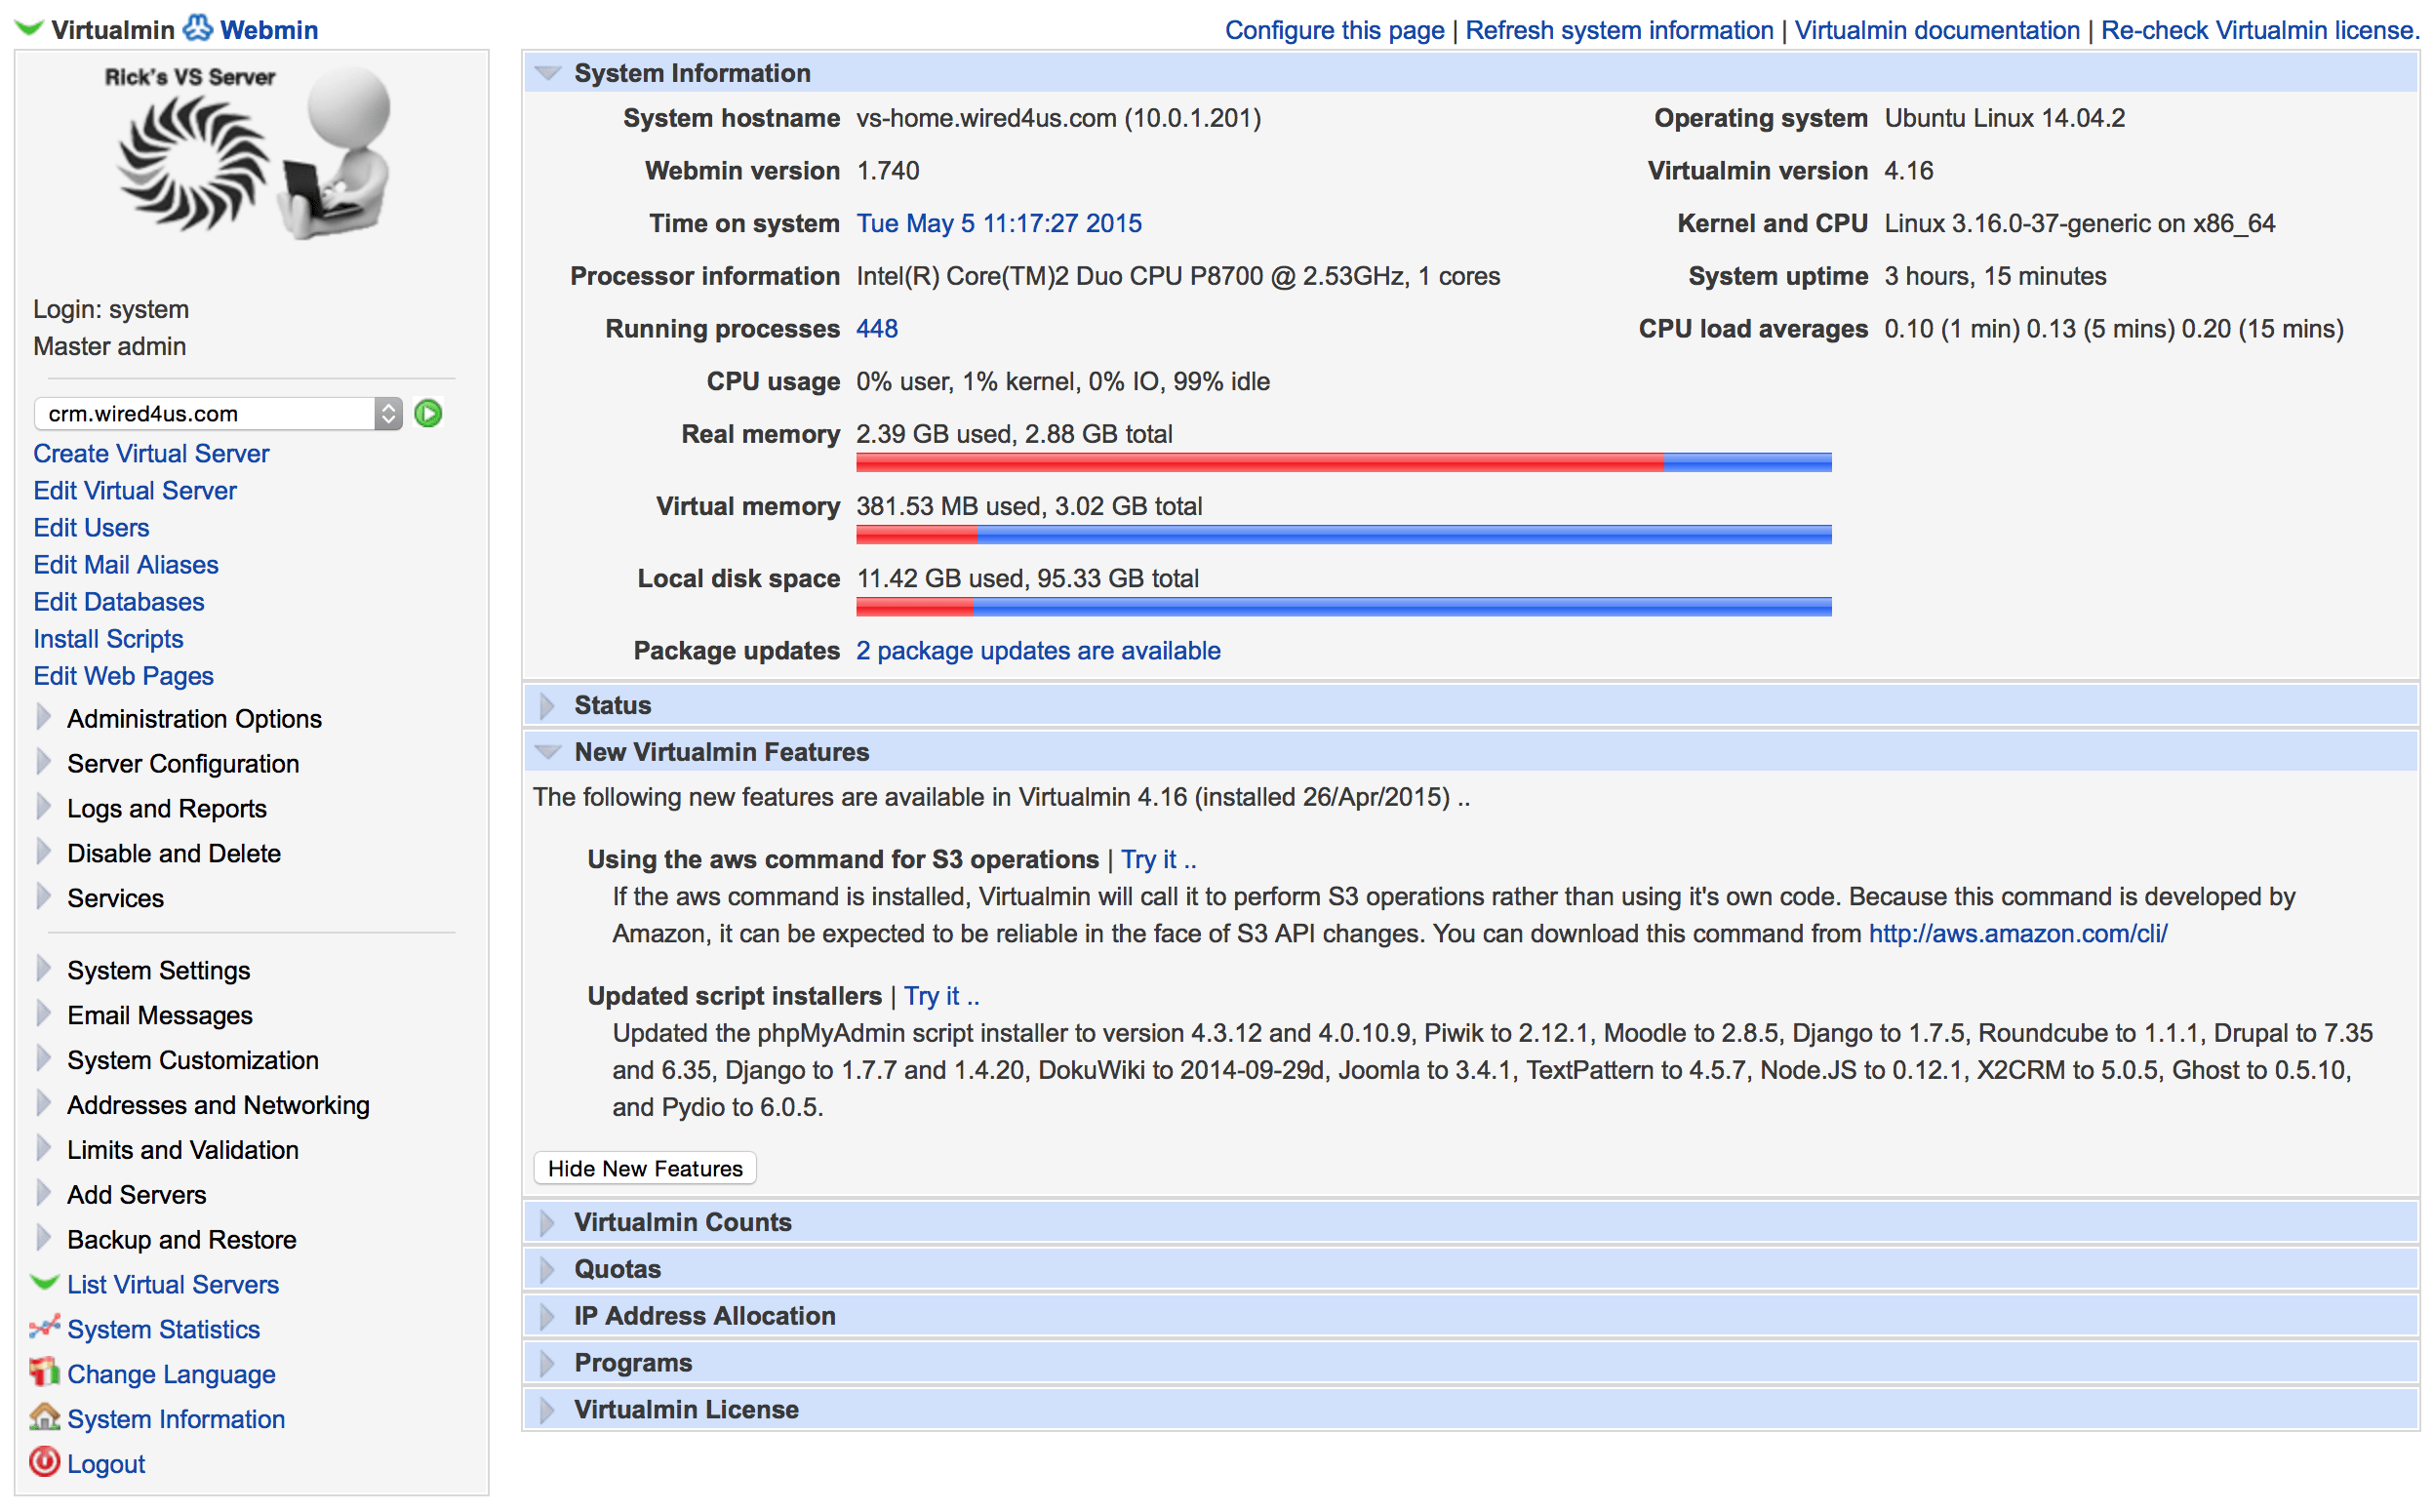
VirtualMin proved to be a very powerful and flexible tool to achieve a sandbox platform. Much like a web hosting control panel for Linux, it creates a “Self-Service” web-panel for managing a limited set of machine resources. Using domain-level segmentation of these resources (like cpu, memory, etc). The technology enables each application (or open-source solutions), to be isolated at the root domain level of a URL context. This allowed us to create multiple landscapes like DEV, QA and SIT on a single VM using different domain names. The entire landscape was built on a 4GB, 2-Core, Ubuntu Linux Server using VMWare Fusion VM running on Mac Mini under Mountain Lion (OSX 10.8). This combined with an MS-based Server 2012 Easy Travel application simulated many of the metrics we would need to define our SLAs and OLAs.
Using VirtualMin enabled us to rapidly deploy applications in an isolated fashion and reduced the overall complexity associated with deployment and configuration for multiple internal applications. We were able to focus on the metrics rather than configuration elements of a given application. Dynatrace would provide the “glue” to rapidly instrument over 60+ turn-key, open-source applications such as Joomla, WordPress, vTiger CRM, Sugar CRM, and many, many more. We could spin up or down solutions at will while have them completely intergrated and instrumented to the APM platform.
Proofing the Concepts (Hybrid Environments)
Having a working sandbox localized to a VM was great, but did it really provide that holistic view that mirrored our real operating landscape – the answer of course was NO. We needed an ability to instrument applications which operated externally to our enterprise as well. In many ways, this could be a considered a “Hybrid Environment”. How could we easily achieve this task in a relatively short period of time? Since we have a fully configured Virtual Private Server (VPS) at BlueHost (ISP) we wondered if we could use that environment as an external integration testbed for Dynatrace with VirtualMin. Unlike the vendor’s highly comprehensive EasyTravel Demo, We wanted to see real traffic flowing between two isolated environments over the Internet.
We were able to install Dynatrace on the VirtualMin server (using Linux) and created an “Enterprise View” system profile in Dynatrace. We then used SSH to login to the BlueHost VPS and SCP’d the agent installer over and installed it pointing it back to localized VM and opening the appropriate ports through the firewall.
From there, we deployed Apache / PHP agent groups, one for the VirtualMin environment and the other for BlueHost ISP. This worked perfectly, now we had full instrumentation of multiple open-source applications and multiple WordPress websites which were externally hosted feeding collectors over the Internet. We could then start creating dashboards which crossed geographic locations, creating an excellent testing platform for User Experience Management (UEM – an optional component of Dynatrace).
With a environment at our disposal which was isolated from the ITIL complexities at work, We were able to start the process of trying to answer some of those fundamental questions since we now had a way to capture key metrics using a solid tool – the Dynatrace Performance Data Warehouse and their pre-built objects (called dashlets).
To begin, we experimented with validation of those elements related to infrastructure starting with the internal Dynatrace Self-Monitoring system profile. We wanted to create some dashboards that could tell us that the APM was in fact operating correctly and collecting the metrics we were interested in.
We also wanted to ensure that the metrics being collected were processed by the tool and not being dropped due to hardware constraints given the limited resources available within the testbed VM. The dashboards had to provide visibility into the PurePath collection statistics to ensure that factors like suspension, MPS, queue-size and skipped session were not going to be a factor which may impact our ability to develop meaningful dashboards.
OpXcel Dashboards
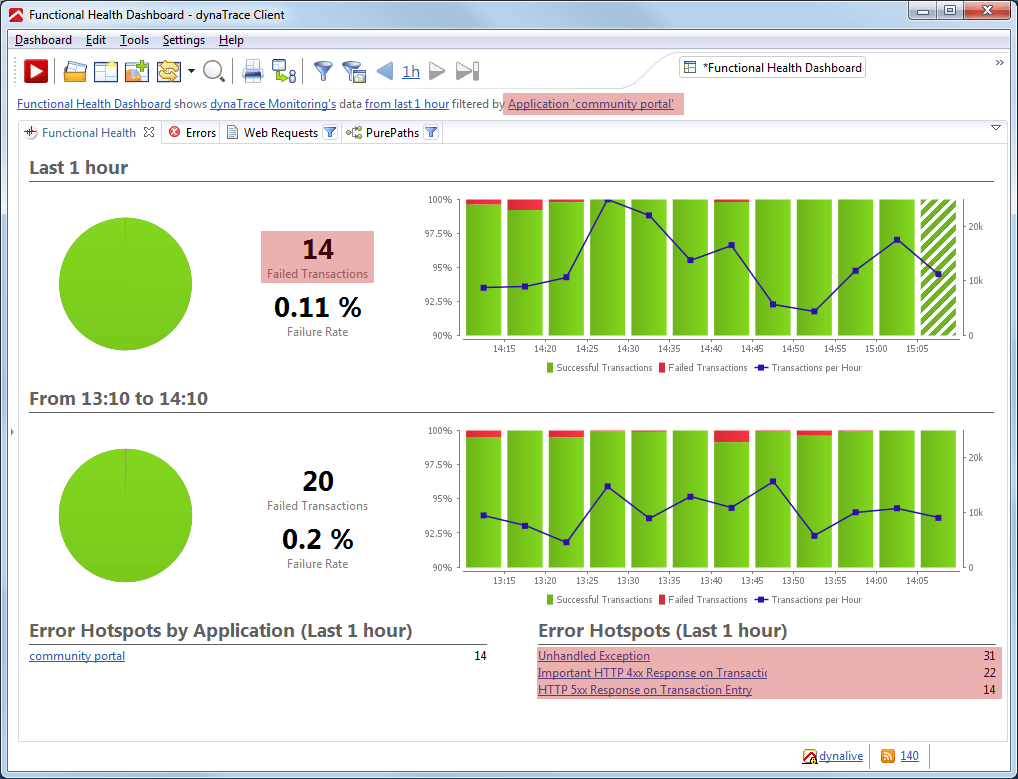
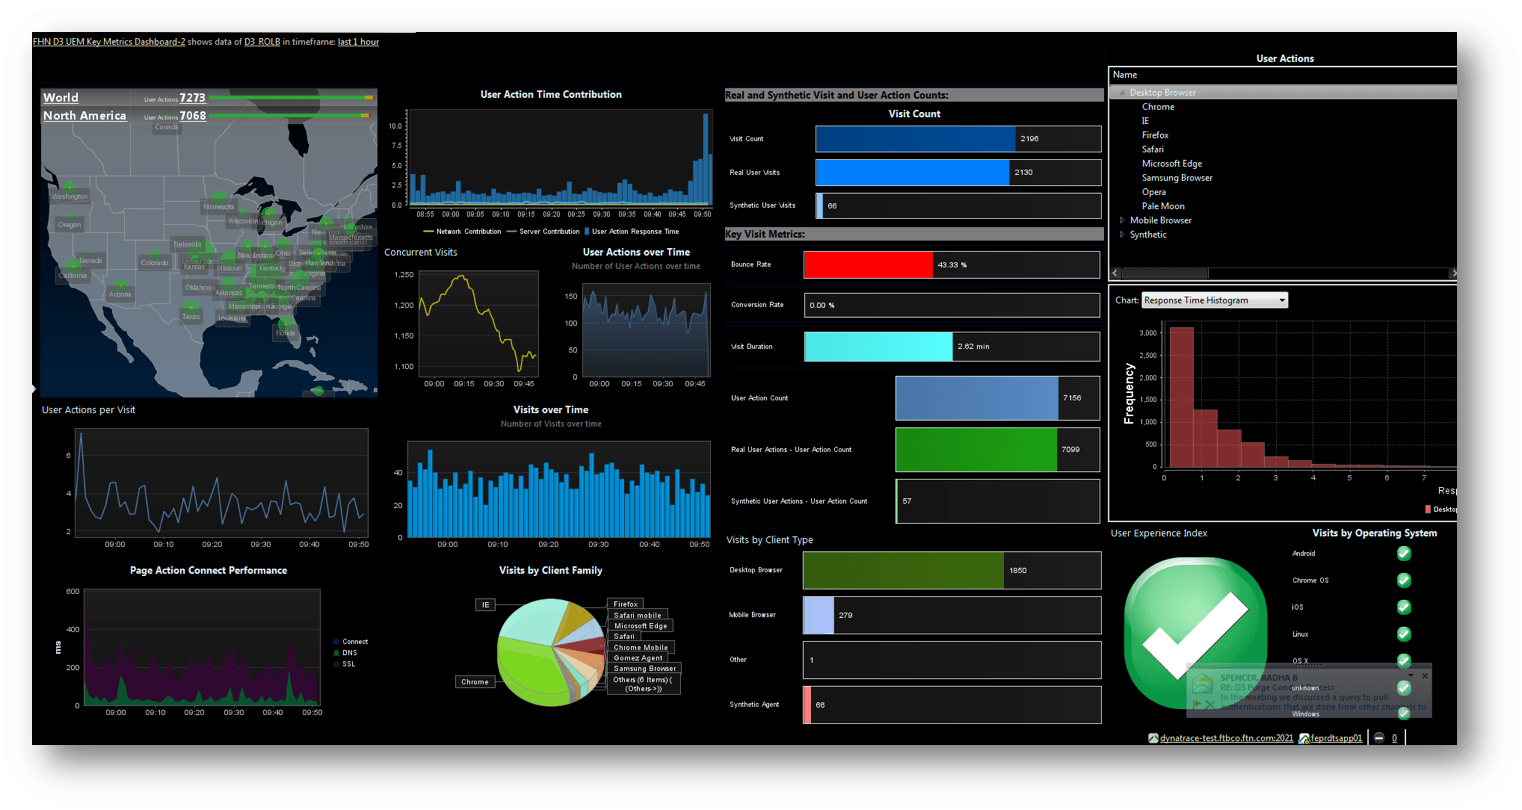
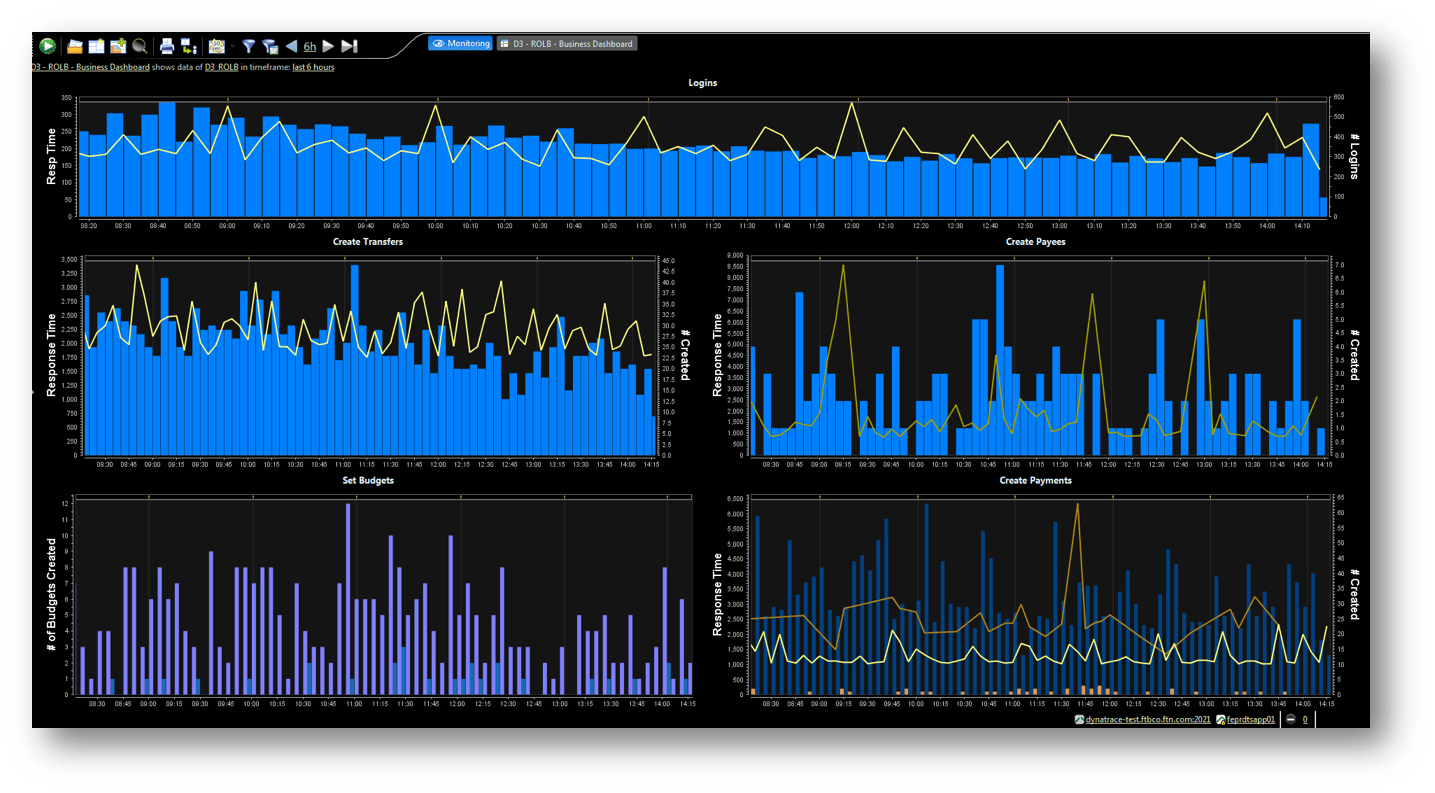
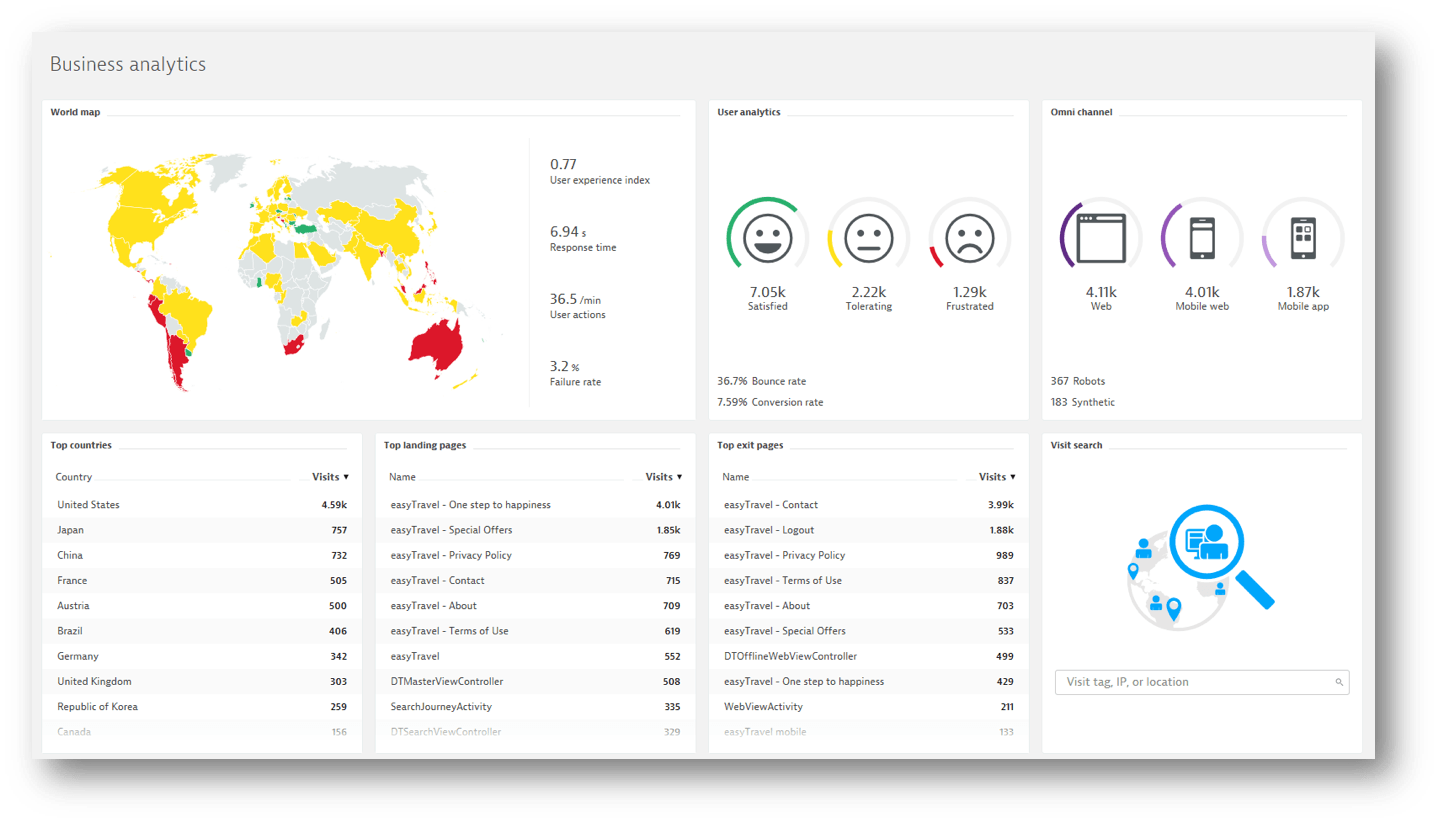
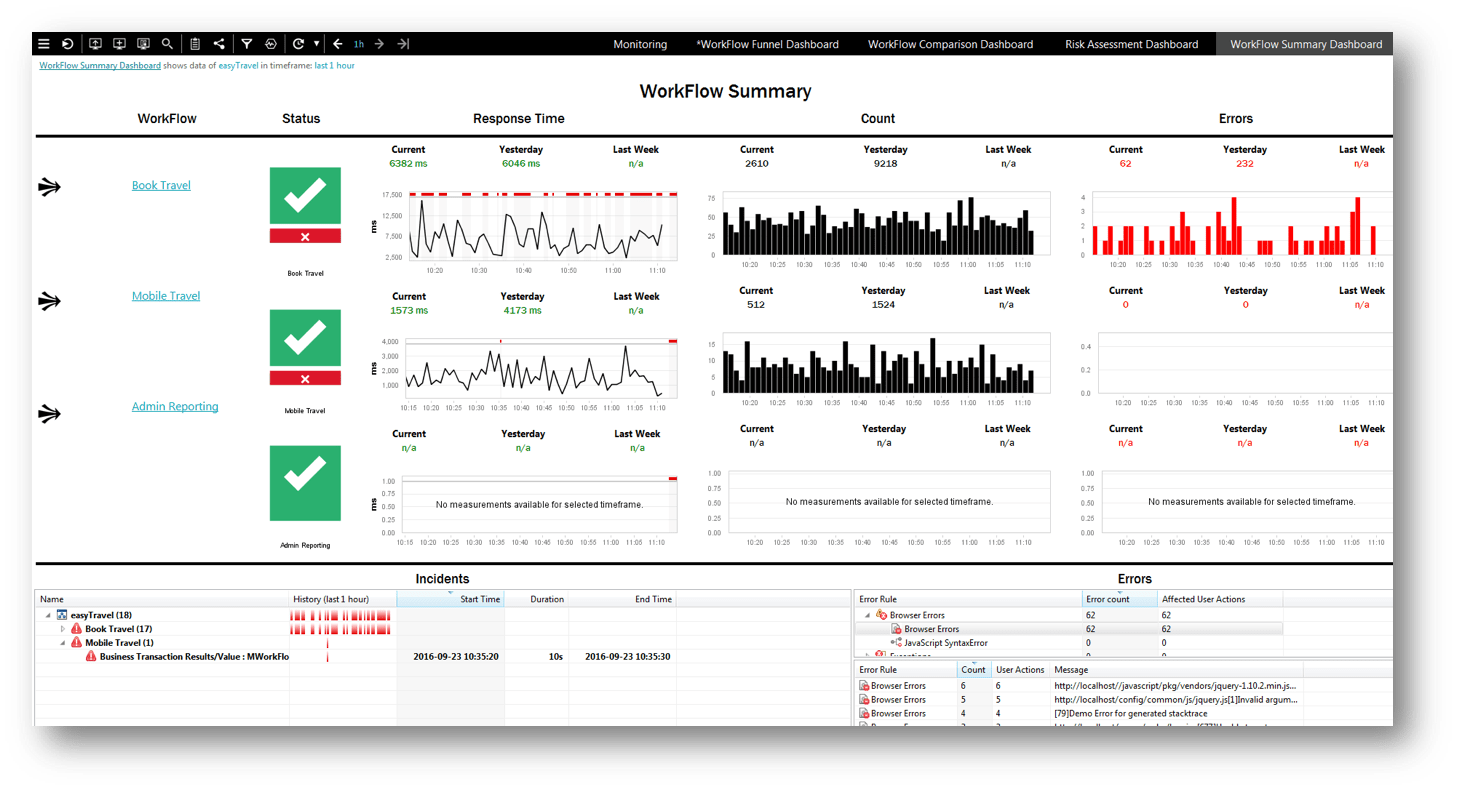
The teams assigned to OpXcel are not developers, therefore the information presented in dashboards had to be very clear and address their areas of interest. We needed to target specific audiences with information relative to their role in OpXcel. This means operations resources in the call center would not want to see PurePath call graphs, rather they needed to very quickly see issues and have enough information to pin-point who to call, often application support teams. Therefore the first set of dashboards were developed with this concept in mind. They are designed to be posted on large screens in the control center to tell operations the health (or state) of the entire enterprise.
With simplicity in mind for OpXcel, other dashboards were created for operations to provide details on the customer experience and not just the transactions. These dashboards had to convey information as to health of the customer-facing applications. To do this, different visuals were used that focused on those metrics like, response times, web request time, user actions and location data (geospatial).
Of course, once people start to use these dashboards there will be changes; therefore it is important to develop dashboards that they can evolve over time. As people begin to consume the information to answer those questions pertaining to OpXcel, their perspectives will change. When designing dashboards the ability to segment information by profile, application and perspective is determined by the use of which dashlets you embed and how their properties are set across APM system profiles.
Wrap-Up
In conclusion, using a sandbox to vet your thinking is great way to not only validate your approach, but it also serves to educate people on the options available as you move towards raising the visibility of the OpXcel initiative.
- We now have executive buy-in from all Lines-Of-Business, each has assigned a “Champion” to participate in the OpXcel initiative
- We have currently developed over 60 custom dashboards across over 200 applications, ranging from custom Java, to .NET to turn-key COTS solutions and everything in between
- Our response time to an outage has been reduced from 90 mins to 10 mins for basic issues such as server restarts, or other manual activities
- We are now working on integrating our APM tools with our ITIL tools to provide a higher level of automation for opening/closing incidents automatically
- We are now developing IT run books which can be triggered automatically via the APM tool or other orchestration tools dynamically based on alerts generated via APM
OpXcel is an ongoing journey which starts with innovative people and a strong desire to take ownership of their part in making it happen. Partnering with your APM provider, (in our case Dynatrace), has made all the difference.
For an example of how to get started, I have developed a DRAFT site which explains how to create a collaborative workspace to help implement the framework, https://opx.think2xit.com …

